Overview of gut regions
1- A 2D map of the Drosophila midgut regions
The
Drosophila digestive tract is divided into three major parts of different developmental origins:
- The foregut, which consists of tissues of ectodermic origin including the pharynx, the esophagus, the crop (a storage food bag), and the proventriculus (the central part of the cardia, which forms a valve at the midgut entrance).
- The midgut forms the central and endodermal part of the gut starting with the outer epithelium layer of the cardia and ending at the midgut-Malpighian tubules junctions.
- The hindgut forms the posterior part of the gut and is also of ectodermal origin.
To increase our knowledge about the Drosophila midgut, we established a map of midgut regions using three distinct approaches:
- A morphometric analysis allowed us to define 6 regions within the midgut (including R0, the endodermic portion of the cardia). See Anatomy
- A histological analysis confirmed the existence of the 6 regions described above and allowed the identification of additional sub-regions: R1a & R1b, R3ab & R3c, and R4a & R4bc. See Histology
- A gene expression pattern analysis including those of 92 reporter transgenes expressed in enterocytes allowed the identification of additional sub-regions in the midgut. The expression pattern of the transgenes used in this study is described in the section Gene expression patterning.
|
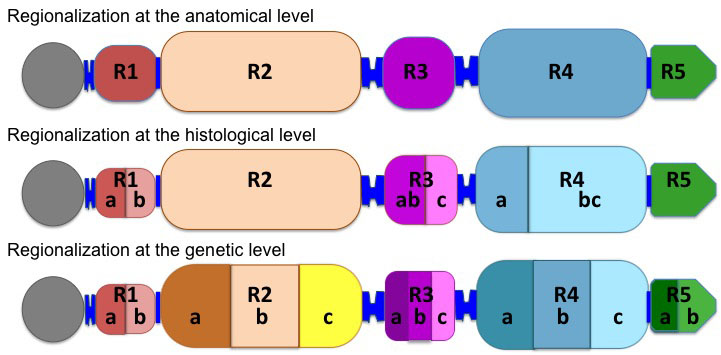 | |
Figure 1: The schematic representation of the Drosophila midgut is based on anatomical, histological and reporter gene expression mapping. Note that the midgut region R0 was not analyzed for subregional details in our study.
|
|
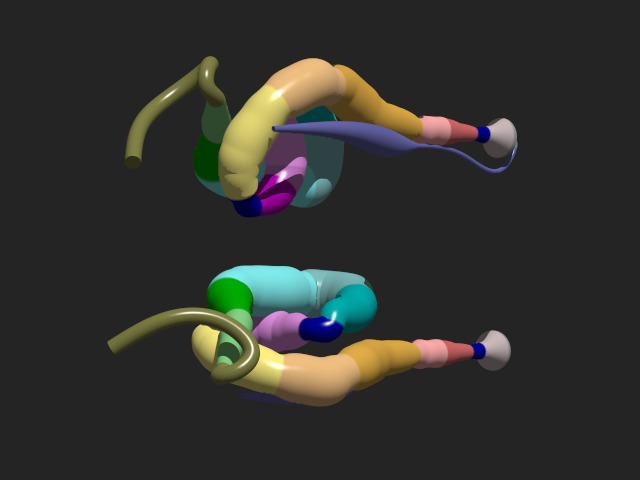
A 3D model of the Drosophila midgut
We generated a 3D reconstruction of the gut based both on a morphometric analysis of the midgut and on measurements performed on histological sections. Shown is a 3D view of the midgut revealing its folding within the body cavity. The distinct midgut regions are colored as indicated in the table; major boundaries are depicted in blue. The table presents the average region coordinates expressed as a percentage of midgut length (0 corresponds to the start and 100 to the end of the midgut).
(Click on the picture to activate the 3D view):
| Color |
Name |
Position |
Anatomical region |
Histological region |
Start (% of midgut) |
Stop (% of midgut) |
|
Crop |
1 |
Crop |
Crop |
|
|
|
cardia (proventriculus) |
2 |
Cardia |
Cardia |
|
|
|
cardia (midgut part) |
3 |
Cardia |
Cardia |
0.0 |
2.3 |
|
Boundary P-1 |
4 |
Boundary P-1 |
Boundary P-1 |
2.3 |
4.0 |
|
R1a |
5 |
R1 |
R1a |
4.0 |
9.0 |
|
R1b |
6 |
R1 |
R1b |
9.0 |
13.0 |
|
R2a |
7 |
R2 |
R2 |
13.0 |
27.0 |
|
R2b |
8 |
R2 |
R2 |
27.0 |
35.0 |
|
R2c |
9 |
R2 |
R2 |
35.0 |
45.0 |
|
Boundary 2-3 |
10 |
Boundary 2-3 |
Boundary 2-3 |
45.0 |
48.0 |
|
R3a |
11 |
R3 |
R3ab |
48.0 |
52.0 |
|
R3b |
12 |
R3 |
R3ab |
52.0 |
54.0 |
|
R3c |
13 |
R3 |
R3c |
54.0 |
59.0 |
|
Boundary 3-4 |
14 |
Boundary 3-4 |
Boundary 3-4 |
59.0 |
62.0 |
|
R4a |
15 |
R4 |
R4a |
62.0 |
69.0 |
|
R4b |
16 |
R4 |
R4bc |
69.0 |
77.0 |
|
R4c |
17 |
R4 |
R4bc |
77.0 |
89.0 |
|
R5a |
18 |
R5 |
R5 |
89.0 |
93.0 |
|
R5b |
19 |
R5 |
R5 |
93.0 |
100.0 |
|
Hindgut |
20 |
Hindgut |
Hindgut |
|
|
