Flygut
: an atlas of the
Drosophila
adult midgut
Home
Overview of gut regions
Anatomy
Histology
Transgene expression mapping
Gene expression
<< Go back to the listing
| Go to stock
Select one item in this list
103491
103492
103493
103495
103497
103498
103514
103516
103517
103518
103519
103522
103527
103533
103536
103538
103542
103550
103551
103553
103554
103555
103574
103575
103580
103585
103589
103590
103591
103595
103596
103602
103605
103606
103608
103610
103631
103634
103635
103636
103637
103687
103746
103853
103854
103860
103863
103865
103878
103882
103900
103902
103904
103910
103922
103923
103928
103930
103943
103972
103986
103988
103989
103992
104001
104012
104028
104053
104064
104070
104130
104173
104178
104181
104184
104191
104193
104268
104274
104312
104359
104363
104429
104481
104503
104530
104563
104679
104810
104836
104876
104973
105069
105152
105156
105201
105202
105221
105259
105328
105339
105362
106143
1099
110560
110565
110568
110570
110572
110602
110605
110611
110614
110636
110643
110647
110726
110751
110775
110777
110780
110781
110787
110796
112009
112041
112132
112446
112451
112462
112465
112480
112482
112486
112511
112518
112607
112663
112741
112869
112906
112920
112950
112994
113052
113094
113118
113180
113244
113269
113273
113276
113280
113303
113370
113427
113455
113498
113545
113832
113838
113846
113916
113950
114002
11527
123608
143fkh
30638
33105
3824
5'Cs
5'HR
A144
A152
A153
A165
BA00164
BA00187
BA00204
BA00207
BA00213
BL23782
BL29142
BL29271
CA06503
CA06506
CA06507
CA06526
CA06597
CA06598
CA06603
CA06614
CA06658
CA06666
CA06750
Cad
DmATP7
FerHCH
Gradient R1
Gradient R2
Gradient R5
H167
Myo1A
NP3048
NPC1b
XB30
btl
c273
c536
cg
dFrz3RFP
lysC
mex
Stock: average pattern
To see a pop-up window showing the entire gut and its regions, click on
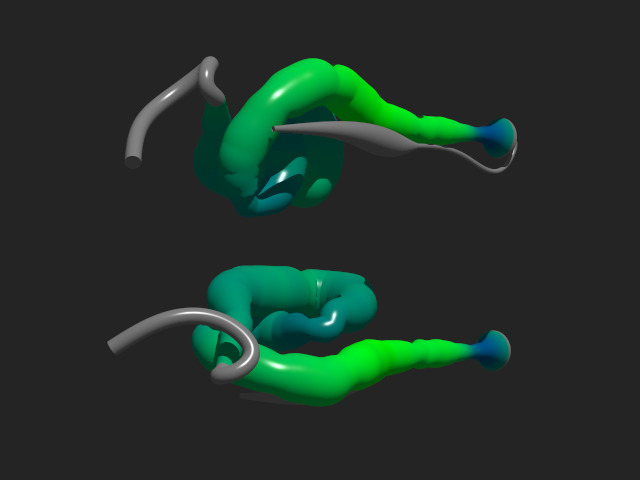
3D view of regions
Legend for pictures: blue for DAPI signal (all nuclei) / green for GFP signal
3D model
3D view of regions